Advanced Features
3 minute read
Prometheus Metrics
The management platform exposes a Prometheus-compatible metrics endpoint at /metrics for integration with monitoring systems.
curl -k https://<board-ip>/metrics
Available Metrics
| Category | Metrics |
|---|---|
| Board identity | Serial number, type, firmware version, board name |
| System health | CPU temperature, memory usage, uptime, load average |
| PoE ports | Total power draw, port count by state (delivering, searching, disabled, fault) |
| SSE clients | Number of connected dashboard sessions |
| Fleet | Total boards, online count |
| Go runtime | Goroutines, memory allocation, garbage collection |
Grafana Integration
A pre-built Grafana dashboard is available for fleet-wide monitoring:
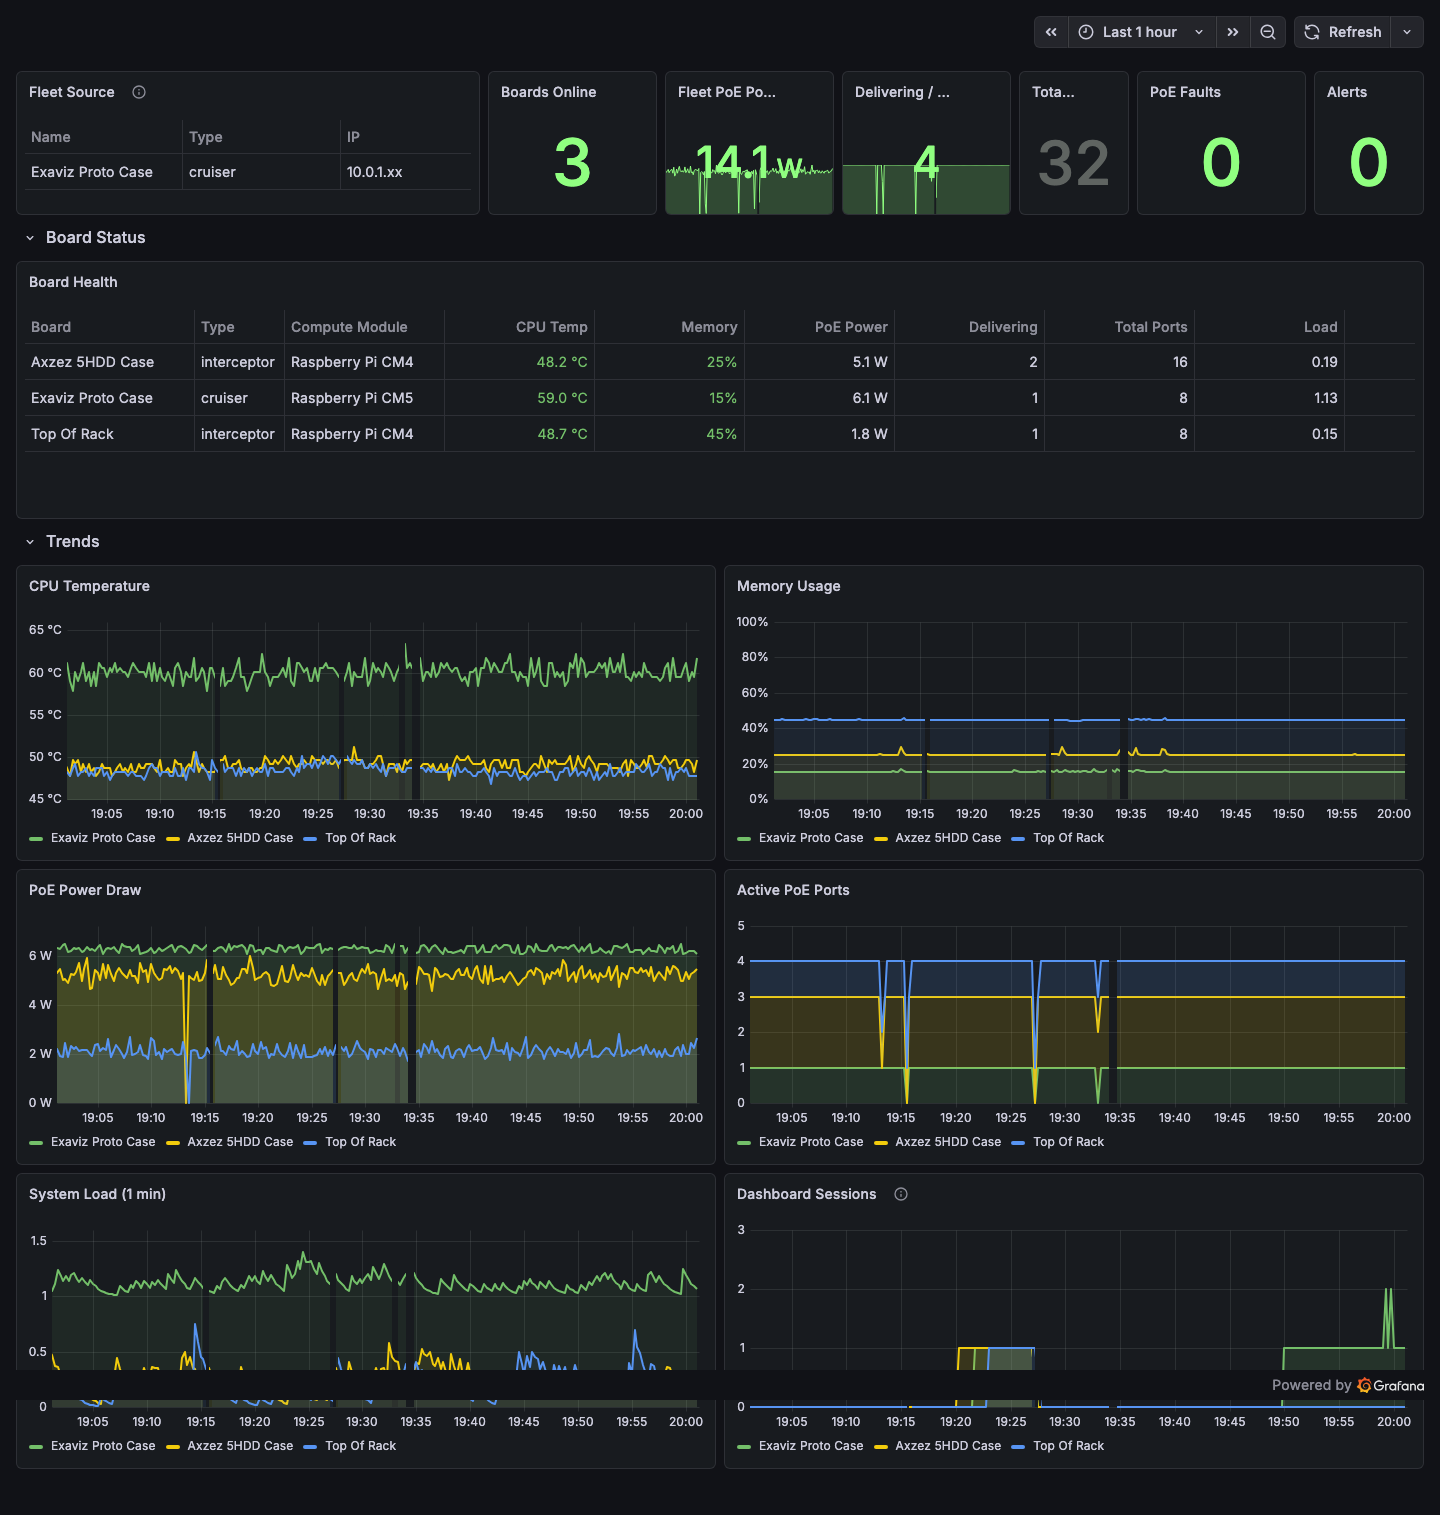
Grafana fleet dashboard showing board health, CPU temperature trends, memory usage, PoE power draw, and active ports across multiple boards.
Point your Prometheus server at https://<board-ip>/metrics and build Grafana dashboards for fleet-wide visibility. Add one scrape target per board in your Prometheus configuration:
scrape_configs:
  - job_name: 'exaviz'
    scheme: https
    tls_config:
      insecure_skip_verify: true
    static_configs:
      - targets: ['10.0.1.41', '10.0.1.42']
File Browser
An optional built-in file browser provides web-based access to the board’s filesystem. When enabled, it is accessible through the dashboard and styled to match the current theme and OEM branding.
The file browser is useful for:
- Browsing log files
- Accessing NVR recordings (if applicable)
- Managing configuration files
- Downloading diagnostic data
HDMI Console (TTY Mode)
The exaviz-console service provides a real-time status display on a monitor connected via HDMI. It shows:
- Board identity (serial, type, firmware version)
- PoE port status with ANSI-colored indicators
- System health metrics (CPU temp, memory, uptime)
- Network status
This is useful for headless deployments where a technician connects a monitor for quick diagnostics without needing a laptop or phone.
After displaying the status screen, the console hands off to the system login prompt for terminal access.
HDMI Kiosk Mode
The exaviz-kiosk service runs the full web dashboard on the board’s HDMI output using Wayland Cage and Chromium. This turns the connected display into a dedicated monitoring screen showing the dashboard in full-screen mode.
Useful for:
- Network operations centers
- Security monitoring rooms
- Lobby displays
- Rack-mounted status panels
Real-Time Events (SSE)
The dashboard uses Server-Sent Events for real-time updates. The browser maintains a persistent connection to /api/v1/events and receives updated PoE port status, switch port status, and system health every 2 seconds.
A green LIVE indicator in the header confirms the connection is active. If the connection drops (network interruption, board reboot), the dashboard automatically reconnects.
Using SSE Programmatically
You can consume the SSE stream from your own applications:
curl -k -N -H "Authorization: Bearer <token>" \
  https://<board-ip>/api/v1/events
Events are delivered as JSON objects containing the current state of all ports and health metrics. This is useful for building custom dashboards or integrating with external monitoring systems without polling.
Board Name
Set a descriptive name for the board that appears in the dashboard header, fleet view, and mDNS announcements:
- Click the board name in the header or go to settings
- Enter a name (e.g., “Building A - Floor 2”, “Server Room Switch”)
- Save
The name is broadcast via mDNS so other boards in the fleet see a friendly name instead of just the serial number.
Last modified April 9, 2026