Getting Started
3 minute read
Accessing the Dashboard
Connect your computer or phone to the same network as your Exaviz board. Open a web browser and navigate to the board’s IP address:
https://<board-ip>
The dashboard uses HTTPS with a self-signed certificate by default. Your browser will show a security warning on first visit. Click “Advanced” and “Proceed” (or equivalent) to continue. You can install your own certificate later. See Security and TLS for details.
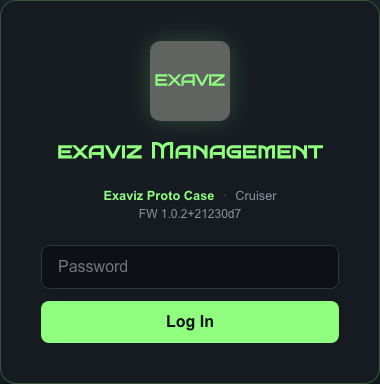
The login page showing the product name and password field.
First Login
On first boot, the default password is admin. You will be required to change it before accessing the dashboard.
- Enter
adminin the password field - Click Log In
- The dashboard will prompt you to set a new password
- Enter your current password (
admin) and choose a new password (minimum 8 characters) - Click Change Password
After changing the password, you will be logged into the dashboard.
The default password must be changed before you can use any API endpoints or dashboard features. This is a security requirement, not optional.
Dashboard Overview
After logging in, you will see the main dashboard. Here is what each section shows:
Header Bar

The header bar shows the product name, board name, view toggle (Board/Fleet), LIVE indicator, and action buttons.
The top bar contains:
- Product name and logo (top left)
- View toggle - Switch between Board view and Fleet view (if fleet is enabled)
- Action buttons - Boards, TLS, Reboot, Light/Dark theme toggle, Logout
- Live indicator - A green pulse shows the dashboard is receiving real-time data
Board Information
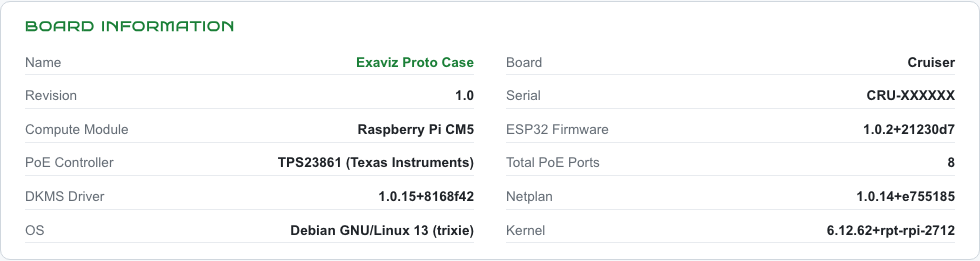
Board information showing name, variant, compute module, serial, firmware versions, and driver versions.
A summary panel showing:
- Board name and variant (Cruiser, Cruiser Lite, Cruiser Keel, or Interceptor)
- Compute module (Raspberry Pi CM4, CM5, etc.)
- PSE controller model
- Serial number
- Firmware and driver versions
Health Metrics

Quick-reference health bar with CPU temperature, memory, load, uptime, mDNS hostname, and total PoE draw.
A row of quick-reference cards:
- CPU Temp - Current processor temperature
- Memory - RAM usage percentage
- Load - System load average
- Uptime - Time since last reboot
- mDNS - Board’s mDNS hostname for fleet discovery
- PoE Draw - Total power being delivered across all ports
PoE Ports
Port tiles arranged in the same physical layout as the board (even ports on top, odd on bottom). Each tile shows the port state, power data, and control buttons. See PoE Port Management for details.
Port Groups
Named groups of ports for bulk operations. See PoE Port Management for details.
Network Ports
A table showing the board’s network switch ports with link status, speed, traffic counters, IP addresses, and MAC addresses.
Recent Activity
The most recent entries from the audit log, showing actions taken on the board.
Theme Toggle
Click the Light or Dark button in the header to switch themes. Your preference is saved and persists across sessions.
Session Expiration
Login sessions expire after 24 hours. You will be redirected to the login page when your session expires. All sessions are invalidated if the password is changed.
Next Steps
- PoE Port Management - Learn how to monitor and control your PoE ports
- Fleet Management - Set up multi-board management
- Security and TLS - Configure HTTPS certificates
Last modified April 9, 2026