System Health
2 minute read
Health Metrics

The health bar shows CPU temperature, memory usage, load average, uptime, mDNS hostname, and total PoE power draw.
The dashboard displays a row of health cards below the board information panel:
| Metric | What It Shows |
|---|---|
| CPU Temp | Current processor temperature in Celsius |
| Memory | RAM usage as a percentage (used / total) |
| Load | System load average (1-minute) |
| Uptime | Time since last reboot (days, hours, minutes) |
| mDNS | Board’s mDNS hostname for fleet discovery |
| PoE Draw | Total power being delivered across all PoE ports |
These metrics update in real-time via the SSE connection (every 2 seconds).
Network Switch Ports
The Network Ports section shows every switch port on the board:
| Column | Description |
|---|---|
| Port | Port name (poe0-poe7, eth0, eth1, ext0, etc.) |
| State | Link state (up/down) with colored indicator |
| Speed | Negotiated speed (100 Mbps, 1000 Mbps, 2500 Mbps) |
| RX | Bytes received |
| TX | Bytes transmitted |
| IP Address | Assigned IP address (if any) |
| MAC | Hardware MAC address |
Switch ports are auto-discovered via the DSA (Distributed Switch Architecture) driver. The table adapts to your board variant.
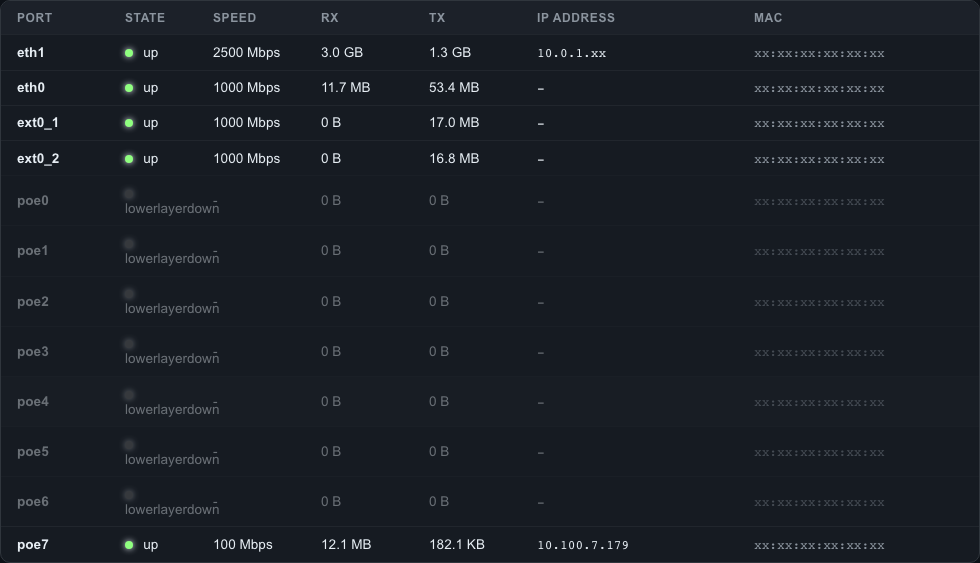
Network ports showing link state, speed, traffic counters, IP addresses, and MAC addresses for all switch and PoE ports.
Reading the Health Data
CPU Temperature
Normal operating range depends on your environment and compute module:
- < 60C - Normal operation
- 60-80C - Warm but acceptable, especially under load
- > 80C - Consider improving ventilation or reducing load
You can configure an alert threshold in the Alerts section.
Memory Usage
- < 50% - Healthy for most workloads
- 50-80% - Normal under heavy load or with NVR/recording applications
- > 90% - May indicate a memory leak or need for more RAM
Load Average
The load average represents the number of processes waiting for CPU time. On a quad-core CM5:
- < 1.0 - Light load
- 1.0-4.0 - Moderate load (one to four cores busy)
- > 4.0 - Heavy load (all cores saturated, processes queuing)
API Access
Health metrics are available via the REST API:
curl -k -H "Authorization: Bearer <token>" \
  https://<board-ip>/api/v1/system/health
See the API Reference for response format.
Last modified April 9, 2026