Deployment and Integration
7 minute read
Deployment and Integration
The Exaviz Management Platform ships as a single Go binary with an embedded SvelteKit frontend. Zero runtime dependencies. No database server. No container runtime. No package manager on the board beyond apt.
Architecture Overview
exaviz-mgmt (single ARM64 binary, ~10 MB)
  |
  |-- HTTP/HTTPS server (Go net/http)
  |     |-- REST API (/api/v1/*)
  |     |-- SSE real-time events (/api/v1/events)
  |     |-- Prometheus metrics (/metrics)
  |     +-- SvelteKit SPA (static assets)
  |
  |-- SQLite database (/var/lib/exaviz/mgmt.db)
  |     |-- Audit log, alerts, groups, prefs, fleet order
  |     +-- WAL mode, pure Go driver, no C dependencies
  |
  |-- PoE reader
  |     |-- Cruiser: /dev/pse (ESP32 serial stream)
  |     +-- Interceptor: /proc/pse (kernel driver)
  |
  |-- mDNS/DNS-SD (_exaviz._tcp.local.)
  |     +-- Board discovery for fleet management
  |
  |-- Fleet aggregator
  |     +-- Polls trusted peers via HTTPS with Ed25519 signatures
  |
  |-- Alert checker
  |     +-- Periodic health/PoE threshold monitoring
  |
  +-- TLS manager
        |-- Self-signed (default)
        |-- Customer cert upload (atomic hot-swap)
        +-- ACME (Let's Encrypt) with auto-renewal
Resource Footprint
| Metric | Value |
|---|---|
| Binary size | ~10 MB (ARM64) |
| Memory (idle) | < 50 MB RSS |
| CPU (idle) | < 1% on CM4/CM5 |
| CPU (SSE active, 1 client) | ~2% |
| Startup time | < 2 seconds |
| Database size | < 1 MB (typical, grows with audit log) |
| Disk total | < 20 MB including frontend assets |
The platform is designed to run alongside your application (NVR, access controller, IoT gateway) without competing for resources.
Service Management
The platform runs as a systemd service:
# Check status
sudo systemctl status exaviz-mgmt

# Restart
sudo systemctl restart exaviz-mgmt

# View logs
sudo journalctl -u exaviz-mgmt -f
Additional Services
| Service | Purpose |
|---|---|
exaviz-mgmt | Main management platform (API + dashboard) |
exaviz-console | TTY status display for HDMI output |
exaviz-filebrowser | Optional web-based file browser |
exaviz-kiosk | Optional kiosk mode (Wayland Cage + Chromium) |
Network Configuration
Ports
| Port | Protocol | Purpose |
|---|---|---|
| 443 (HTTPS) | TCP | Dashboard and API (default) |
| 80 (HTTP) | TCP | Redirects to HTTPS |
| 5353 | UDP | mDNS for fleet discovery |
Firewall Considerations
- Port 443 must be accessible from any device that needs to use the dashboard or API
- Port 5353 (mDNS) must be open between boards for fleet discovery. mDNS uses multicast on the local network segment.
- No outbound internet required unless using ACME (Let’s Encrypt), which needs outbound HTTPS to the ACME provider
TLS Setup
Self-Signed (Default)
On first boot, the platform generates a self-signed certificate. The dashboard is immediately accessible via HTTPS. Browsers will show a certificate warning, which users can accept to proceed.
Custom Certificate Upload
Upload your own certificate via the API or dashboard:
curl -k -X POST -H "Authorization: Bearer <token>" \
  -F "cert=@server.crt" -F "key=@server.key" \
  https://<board-ip>/api/v1/system/tls/upload
The certificate is hot-swapped atomically. No service restart required. The old certificate is replaced immediately and new connections use the new certificate.
ACME (Let’s Encrypt) - HTTP-01
For boards with a public DNS name, the built-in ACME client handles certificate requests and auto-renewal:
curl -k -X PUT -H "Authorization: Bearer <token>" \
  -H "Content-Type: application/json" \
  -d '{"mode": "acme"}' \
  https://<board-ip>/api/v1/system/tls/mode
The ACME client uses the HTTP-01 challenge method. Port 80 must be accessible from the internet for validation.
DNS-01 Challenge for Air-Gapped Deployments
For boards on private networks where inbound internet access is not available (government, defense, air-gapped, enterprise), use DNS-01 challenges from a separate machine and push the certificate via the upload API.
The board never needs to be internet-accessible. Only the machine running certbot needs internet access and your DNS provider’s API credentials.
Manual workflow:
# On any machine with internet access
sudo certbot certonly --manual --preferred-challenges=dns \
  -d board.yourdomain.com

# Add the TXT record to your DNS when prompted, then press Enter
# Verify: dig +short TXT _acme-challenge.board.yourdomain.com

# Push to the board
curl -k -X POST -H "Authorization: Bearer <token>" \
  -F "cert=@/etc/letsencrypt/live/board.yourdomain.com/fullchain.pem" \
  -F "key=@/etc/letsencrypt/live/board.yourdomain.com/privkey.pem" \
  https://<board-ip>/api/v1/system/tls/upload
Automated workflow for fleets:
Full automation requires a DNS provider with API access for programmatic TXT record creation. Not all providers support this (for example, name.com does not). If your provider lacks API support, the manual workflow above still works - you create the TXT record by hand each renewal cycle. For OEMs choosing a DNS provider for fleet cert management, Cloudflare (free tier available) and DigitalOcean both have well-supported certbot plugins.
Use a DNS provider plugin to automate TXT record creation, then distribute to all boards:
# Automated renewal via Cloudflare DNS plugin (example)
sudo certbot certonly --dns-cloudflare \
  --dns-cloudflare-credentials ~/.secrets/cloudflare.ini \
  -d "*.boards.example.com"

# Distribute the wildcard cert to all boards
for board in 10.0.1.41 10.0.1.42 10.0.1.43; do
  curl -sk -X POST -H "Authorization: Bearer ${TOKEN}" \
    -F "cert=@/etc/letsencrypt/live/boards.example.com/fullchain.pem" \
    -F "key=@/etc/letsencrypt/live/boards.example.com/privkey.pem" \
    "https://${board}/api/v1/system/tls/upload"
done
DNS-01 supports wildcard certificates, so a single *.boards.example.com cert covers every board in the fleet. Supported DNS provider plugins include Cloudflare, DigitalOcean, AWS Route 53, and many others.
We provide automation guidance and can assist with custom certificate distribution scripts as part of OEM support engagements.
Board Variant Auto-Detection
The platform automatically detects the board variant at startup using a tiered approach:
- Device tree - Reads board model from
/proc/device-tree/model - Config file - Checks
/boot/firmware/config.txtfor board-specific overlays - PSE interface - Detects which PSE interface is available (
/dev/psefor Cruiser,/proc/psefor Interceptor)
The UI adapts to show the correct number of PoE ports, switch ports, and features for each variant. No manual configuration required.
| Board | Detection | PoE Ports | PSE Interface |
|---|---|---|---|
| Cruiser | Device tree + /dev/pse | 8 (2x4 via TPS23861) | /dev/pse (ESP32 serial) |
| Cruiser Lite | Device tree + /dev/pse | 4 (1x4 via TPS23861) | /dev/pse (ESP32 serial) |
| Cruiser Keel | Device tree (no PSE) | 0 (4 switch ports) | None |
| Interceptor | Device tree + /proc/pse | 8-16 (1-2x IP808AR) | /proc/pse (kernel driver) |
Fleet Deployment
Discovery
Boards on the same network subnet discover each other automatically via mDNS. Each board announces itself on _exaviz._tcp.local. with TXT records containing serial number, board type, firmware version, and user-defined name.
Pairing
Fleet pairing uses Ed25519 TOFU (Trust On First Use). See the Fleet Management user guide for the step-by-step process.
For large deployments, boards can be paired in bulk by pre-populating the fleet trust file (/var/lib/exaviz/fleet.json) with known public keys before deployment.
Configuration Cloning
To deploy consistent configuration across a fleet:
- Configure one board fully (branding, labels, groups, alerts, TLS)
- Export a backup via the API:
GET /api/v1/system/backup - Restore the backup to each additional board:
POST /api/v1/system/restore
Or include the configuration in your custom OS image for zero-touch deployment.
Prometheus and Grafana Integration
The platform exposes metrics at /metrics in Prometheus exposition format. A complete monitoring stack (Prometheus + Grafana + nginx reverse proxy) ships in the management platform source repository, ready to deploy with docker compose up -d.
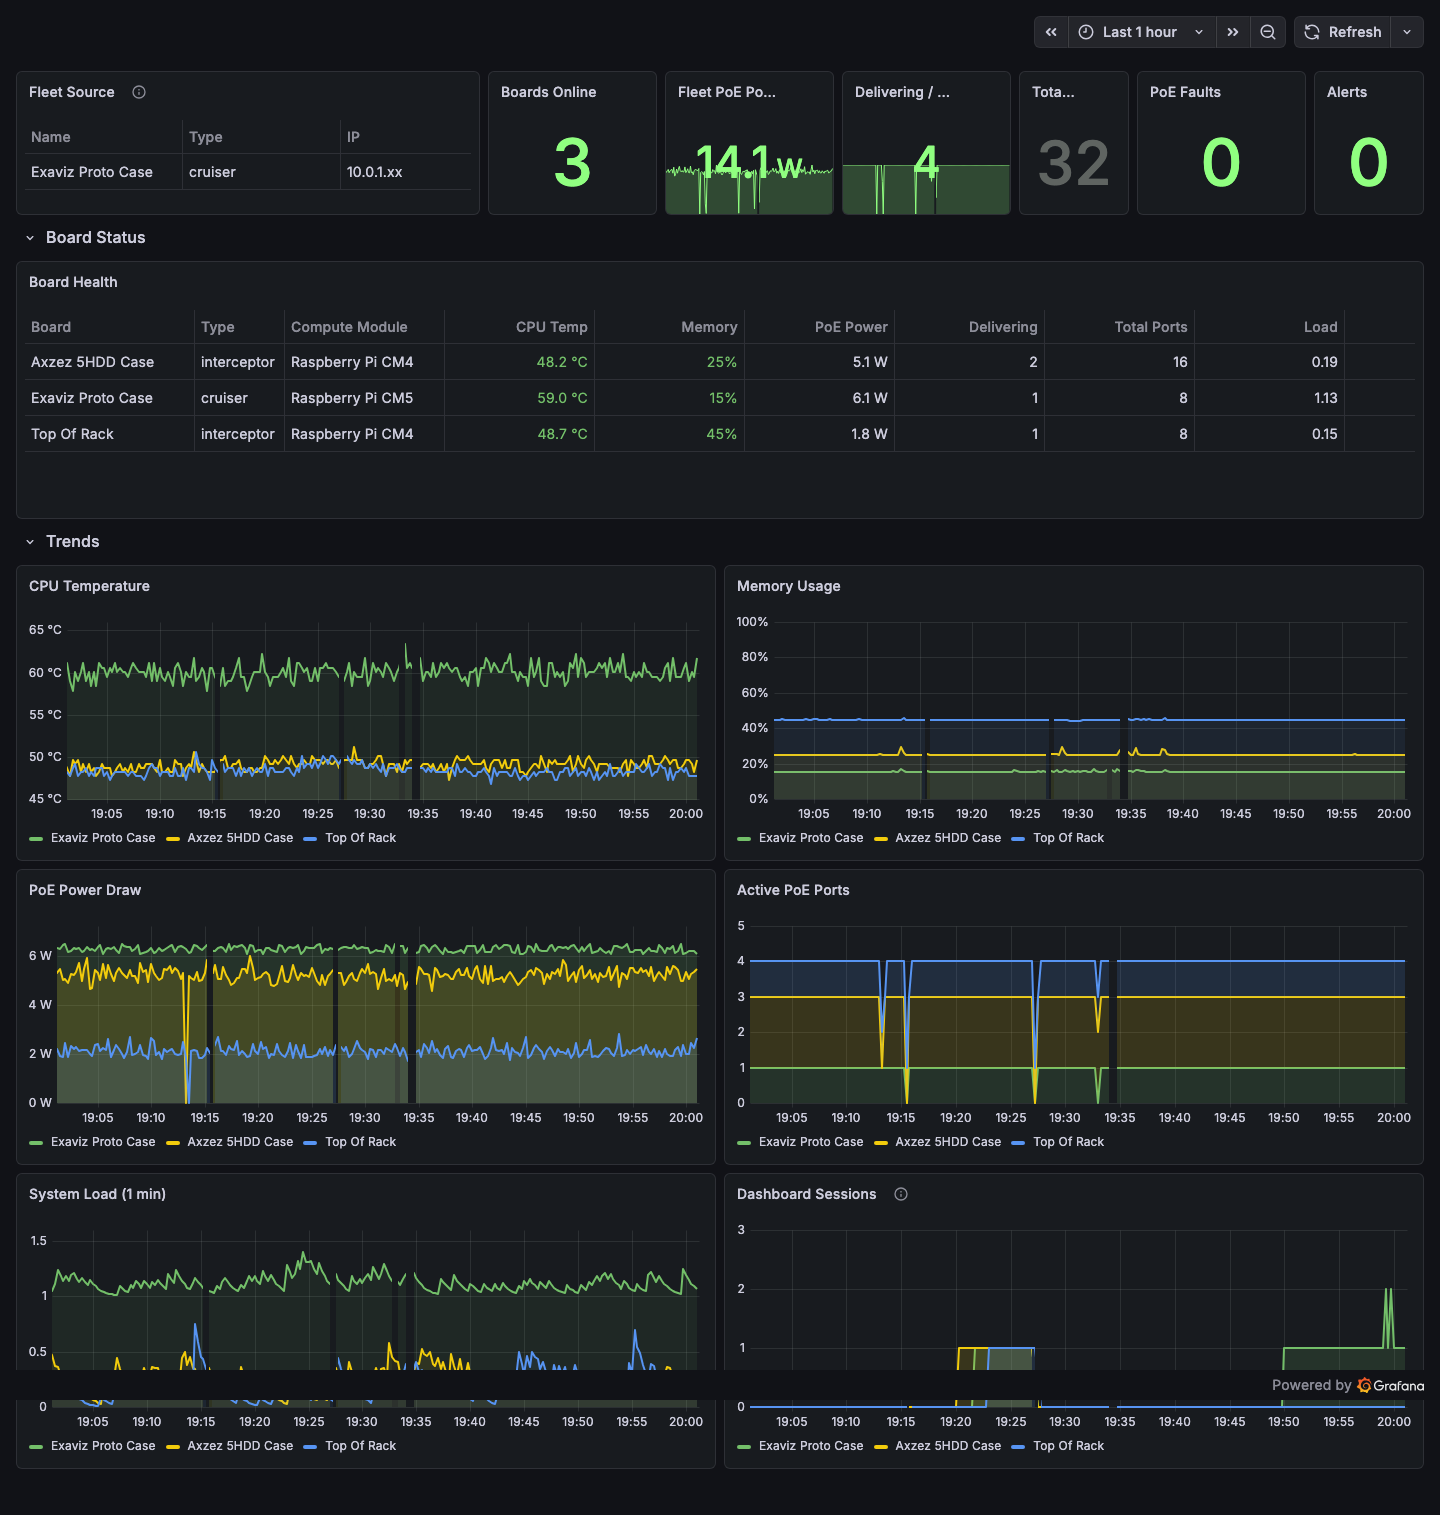
The included Grafana dashboard showing fleet summary, per-board health with color-coded thresholds, and trend charts for CPU temperature, memory, PoE power, active ports, system load, and dashboard sessions.
To integrate:
- Add the board as a scrape target in your Prometheus configuration:
scrape_configs:
  - job_name: 'exaviz'
    scheme: https
    tls_config:
      insecure_skip_verify: true  # for self-signed certs
    static_configs:
      - targets:
        - '10.0.1.41'
        - '10.0.1.42'
        - '10.0.1.43'
- Import or build Grafana dashboards using the available metrics (board identity, system health, PoE port states, fleet status).
A sample Docker Compose stack (Prometheus + Grafana + Nginx reverse proxy) is available in the management platform source repository under monitoring/.
Package Updates
The management platform is distributed as a Debian package (exaviz-management). Updates are delivered via the Exaviz apt repository:
sudo apt update
sudo apt upgrade exaviz-management
The service restarts automatically after an upgrade. Configuration, port labels, fleet trust state, and audit logs are preserved across upgrades.
Configuration File
The management platform reads configuration from /etc/exaviz/management.json:
{
  "listen_addr": ":443",
  "pse_device": "/dev/pse",
  "data_dir": "/var/lib/exaviz",
  "web_dir": "/usr/share/exaviz/web",
  "branding": {
    "product_name": "Your Product",
    "logo_url": "/assets/logo.svg",
    "primary_color": "#90FF80",
    "support_url": "https://support.example.com"
  }
}
See the White-Label Guide for complete branding configuration options.
Data Directory
All persistent state is stored in /var/lib/exaviz/:
| File | Contents |
|---|---|
mgmt.db | SQLite database (audit log, alerts, groups, prefs, fleet order) |
fleet.json | Ed25519 key pair and trusted peer list |
auth.json | Password hash and session tokens |
tls/ | TLS certificates and keys |
This directory is included in backup exports and should be preserved across OS reimaging if you want to retain board configuration.
Last modified April 9, 2026