Feature Overview
11 minute read
Feature Overview
The Exaviz Management Platform is a browser-based dashboard and REST API that runs directly on the board. Every feature described here is included with every board at no additional cost.
PoE Port Management
The dashboard provides real-time visibility and control over every PoE port on the board.
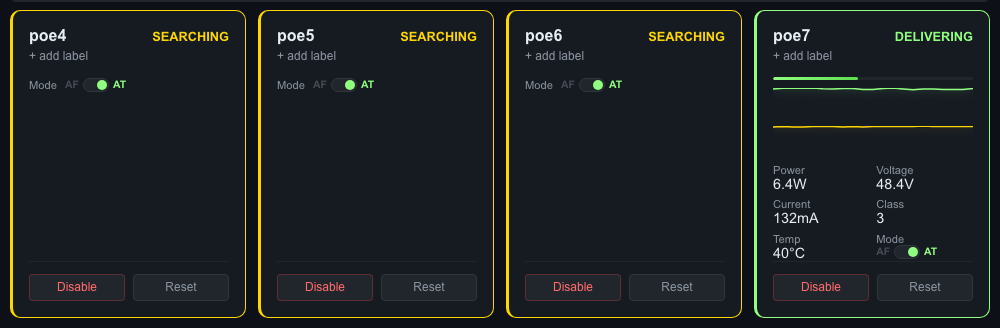
Four PoE port tiles on a Cruiser board. Port 3 (“Server Switch”) is delivering 6.3W at 48.4V with power and temperature sparklines. Ports 0-2 are searching for devices. Each port shows mode toggle, disable, and reset controls.
Real-Time Monitoring
Each port displays:
- Power state - Delivering, searching, disabled, fault, or backoff
- Power consumption - Voltage (V), current (mA), and wattage (W)
- Temperature - Per-port PSE temperature in Celsius
- PoE class - Device class (0-4) and allocated power
- Sparklines - Rolling 1-hour power and temperature graphs (60 samples at 1-minute intervals)
Port tiles are arranged in a physical board layout (even ports on top row, odd on bottom) so the dashboard matches what you see on the hardware.
Port Control
- Enable/Disable - Turn power on or off for individual ports
- Reset - Power-cycle a port (disable, wait, re-enable) to recover stuck devices
- Mode switching - Toggle between 802.3at (PoE+, 30W) and 802.3af (PoE, 15.4W) per port
Port Labels
Assign custom names to each port (e.g., “Lobby Camera”, “AP Floor 2”). Labels persist across reboots and are stored locally on the board. Labels appear on port tiles and in the fleet view.
Port Groups
Create named groups of ports for bulk operations:
- Group creation - Select ports, name the group, save
- Bulk enable/disable/reset - Apply operations to all ports in a group with one click
- Use cases - “All Cameras”, “Floor 1 APs”, “Conference Room”
Why this matters for OEMs: Your customers can manage devices by function rather than port number. A building manager enables all cameras with one click instead of remembering which ports connect to which devices.
Here is a closer look at a single port tile when a device is connected and receiving power:
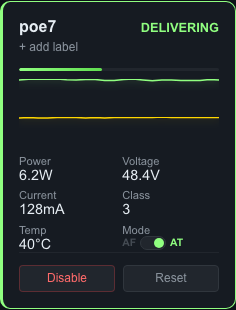
Port 3 delivering 6.3W to “Server Switch.” Power, voltage, current, class, temperature, and mode are all visible at a glance. Sparklines show the last hour of power and temperature history.
Connected Device Identification
The dashboard automatically identifies what is plugged into each PoE port. When a device is connected and receiving power, the port tile shows:
- Manufacturer - Identified from the device’s MAC address using an embedded OUI (vendor) database covering major camera, access point, phone, and network equipment manufacturers
- Hostname - Resolved via reverse DNS lookup
- IP address - From the board’s ARP table
- MAC address - Hardware address of the connected device
For example, a port tile might show: “Axis Camera - 10.0.1.100 - axis-cam-01.local” below the port label.
The OUI database covers manufacturers including Axis, Hikvision, Dahua, GeoVision, Ubiquiti, Aruba, Ruckus, Polycom, Yealink, Raspberry Pi, and dozens more. OEMs can add custom MAC prefixes via configuration for proprietary hardware.
Why this matters for OEMs: Your customers no longer need to maintain a spreadsheet mapping ports to devices. The dashboard tells them what is on each port automatically. When a device goes offline or develops a fault, they know exactly which device is affected without tracing cables.
Fleet Management
Manage multiple boards from a single dashboard. Fleet management uses mDNS for discovery and Ed25519 cryptographic pairing for security.
Automatic Discovery
Boards on the same network discover each other automatically via mDNS/DNS-SD. Each board announces itself on _exaviz._tcp.local. with metadata including serial number, board type, firmware version, and user-defined name.
New boards appear in the discovery list within seconds of connecting to the network.
Secure Pairing
Pairing uses Ed25519 TOFU (Trust On First Use) with visual confirmation:
- Board A discovers Board B via mDNS
- User on Board A clicks “Pair”
- Both boards independently compute a 6-digit confirmation code
- Users verify the codes match (prevents man-in-the-middle attacks)
- Both boards store each other’s public keys
Trust is bilateral, not transitive. If Board A pairs with Board B and Board C, Boards B and C do not automatically trust each other. This is intentional: compromising one board does not compromise the entire fleet.
Fleet Dashboard
Once boards are paired, the fleet view provides:
- Board cards - Grid layout (4 across) showing each board’s name, serial, type, status, and summary metrics
- Table view - Comparative columns (CPU temp, total power, memory, online/offline)
- Quick expand - Click a board card to see its ports in a 2x2 inline grid
- Drag-and-drop reorder - Arrange boards in the order that makes sense for your deployment
- Problematic boards float to top - Boards with faults or alerts automatically surface (toggle on/off)
- Fleet-wide status bar - Total boards, online count, total power draw, active ports
- Fleet-wide alerts - “3 PoE faults across 2 boards”, “Board offline 5 min ago”
Remote Operations
From the fleet view, operators can:
- Reboot individual boards (with confirmation dialog)
- Enable, disable, or reset all ports on a specific board
- Bulk reboot the entire fleet (staggered timing to avoid power surges)
- Export fleet status as a snapshot report
Why this matters for OEMs: Your customers deploying 5, 10, or 50 boards across a building or campus get a single pane of glass for the entire deployment. No separate controller appliance. No cloud account. Just one dashboard on any board in the fleet.
System Health Monitoring
The health bar provides at-a-glance board status:

Real-time health metrics: CPU temperature (59C), memory usage (15%), load average (1.03), uptime (7 days), mDNS hostname, and total PoE power draw (6.4W).
The dashboard displays real-time system metrics for the board itself:
| Metric | Source | Details |
|---|---|---|
| CPU temperature | /sys/class/thermal/thermal_zone0/temp | Celsius, with configurable alert threshold |
| Memory usage | /proc/meminfo | Total, used, and percentage |
| System uptime | /proc/uptime | Days, hours, minutes since last boot |
| Load average | /proc/loadavg | 1, 5, and 15-minute averages |
| Hostname | System | Board hostname and user-defined name |
| Kernel version | System | Running kernel version and architecture |
Network Switch Ports
The dashboard also monitors the board’s network switch ports (auto-discovered via DSA):
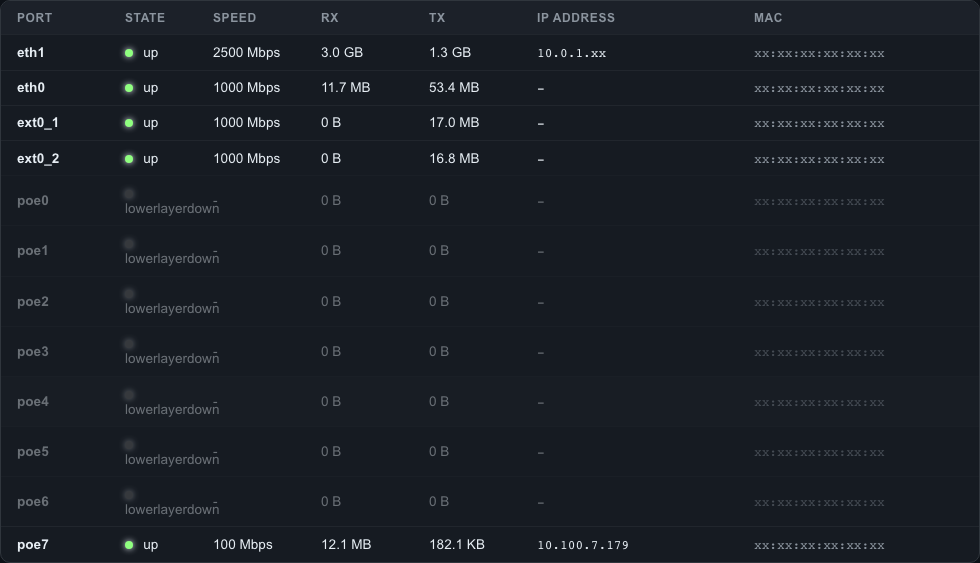
Network ports table showing link state, negotiated speed, traffic counters, IP addresses, and MAC addresses. The 2.5GbE WAN uplink (eth1) and connected PoE device (poe7) are highlighted as “up.”
- Link status (up/down)
- Speed and duplex
- Traffic counters (RX/TX bytes, packets, errors, drops)
Why this matters for OEMs: Your support team can check board health remotely. CPU temperature trending up? Memory filling? A switch port dropping packets? Visible at a glance, before it becomes a customer complaint.
Alerting
The platform monitors health metrics and PoE port states, generating alerts when thresholds are crossed.
Alert Types
| Alert | Trigger | Example |
|---|---|---|
| CPU temperature | Exceeds configured threshold | “CPU temperature 85C exceeds 80C threshold” |
| Memory usage | Exceeds configured percentage | “Memory usage 92% exceeds 90% threshold” |
| PoE fault | Port enters fault state | “Port 3 (Lobby Camera) entered fault state” |
Alert Behavior
- Alerts are stored persistently in SQLite
- Active alerts appear in the dashboard and fleet view
- Alerts include severity level, timestamp, and resolution tracking
- Users can manually resolve alerts once the issue is addressed
Why this matters for OEMs: Proactive monitoring means your customers find out about problems from the dashboard, not from an angry phone call. Alert data is available via the API for integration with your own monitoring systems.
Security
Security is not an afterthought. The management platform is penetration tested before every release, and we can provide test evidence on request. The platform is designed for deployment in government, defense, and enterprise environments where security audits are mandatory.
Authentication
- First boot: Default password (
admin) with forced change before any API access is granted - Token-based sessions: Bearer tokens with 24-hour expiration
- Rate limiting: 10 login attempts per minute per IP address (sliding window)
- Password hashing: SHA-256
TLS (HTTPS)
Three modes, selectable at any time:
| Mode | Description |
|---|---|
| Self-signed (default) | Auto-generated certificate on first boot. Works immediately. |
| Customer upload | Upload your own certificate and key via the API or dashboard. Atomic hot-swap with no service restart. |
| ACME - HTTP-01 | Built-in ACME client handles certificate requests and auto-renewal. Requires inbound port 80. |
| ACME - DNS-01 | For air-gapped and private networks. Run certbot externally, push cert via API. Board never needs internet access. Supports wildcard certs for fleet-wide coverage. |
HSTS headers are enabled by default (configurable, 1-year max-age).
Why this matters for OEMs: Government and defense deployments often prohibit inbound internet access. DNS-01 lets your customers get trusted Let’s Encrypt certificates without exposing the board to the internet. Wildcard certificates cover an entire fleet with a single cert. We provide automation guidance and fleet distribution scripts as part of support engagements.
Audit Logging
Every mutating action is recorded in SQLite:
- Timestamp - When the action occurred
- Action - What was done (e.g., “port_disable”, “password_change”, “fleet_pair”)
- Actor - Who did it (IP address)
- Target - What was affected (e.g., “pse0/port3”)
- Detail - Additional context
Audit logs are queryable via the API with pagination (limit/offset). Logs are included in backup exports.
Why this matters for OEMs: Government, defense, and enterprise customers require audit trails. This is built in, not bolted on. No additional configuration needed.
Penetration Tested
Every release undergoes automated penetration testing covering OWASP Top 10 categories, authentication bypass, injection attacks, and API security. Test reports are available on request for customers who require security evidence for procurement or compliance reviews.
Dark and Light Themes
The dashboard ships with both dark and light themes. Users toggle between them with a single click. The theme preference persists across sessions (stored both in the browser and on the board).
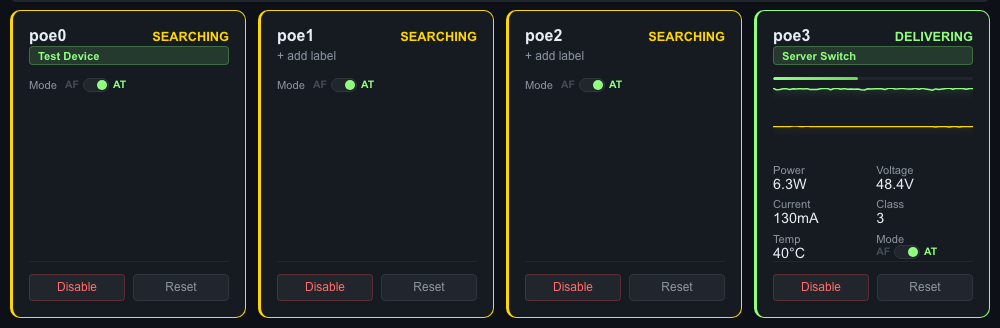
The same PoE port cards in light mode. Every element adapts automatically when the user toggles themes.
CSS Variable System
All visual styling uses CSS custom properties (~25 variables). Changing the variable values rethemes the entire UI:
- Backgrounds, borders, and shadows
- Text colors (primary and secondary)
- Accent color (links, active states, buttons)
- Danger and warning colors
- Card and input styling
This is the same system used for OEM branding. See the White-Label Guide for details.
Why this matters for OEMs: Your customers get a polished, modern interface in both dark and light modes. The visual quality signals a professional product, not a dev board with a hastily built web page.
Backup and Restore
Backup
Export the board’s entire configuration as a .tar.gz archive via the API or dashboard. The backup includes:
- Port labels and port groups
- Alert configuration and history
- Audit log
- User preferences (theme, view mode)
- Fleet trust state (paired board keys)
- TLS certificates
- OEM branding configuration
Restore
Upload a backup archive to restore a board to a previous state or clone configuration across boards.
Why this matters for OEMs: Deploy one board, configure it perfectly, export the backup, and restore it to every board in the fleet. Consistent configuration at scale without manual setup on each device.
Prometheus Metrics and Grafana Integration
The platform exposes a Prometheus-compatible metrics endpoint at /metrics for integration with existing monitoring infrastructure. A ready-to-deploy Grafana dashboard is included for fleet-wide visibility.
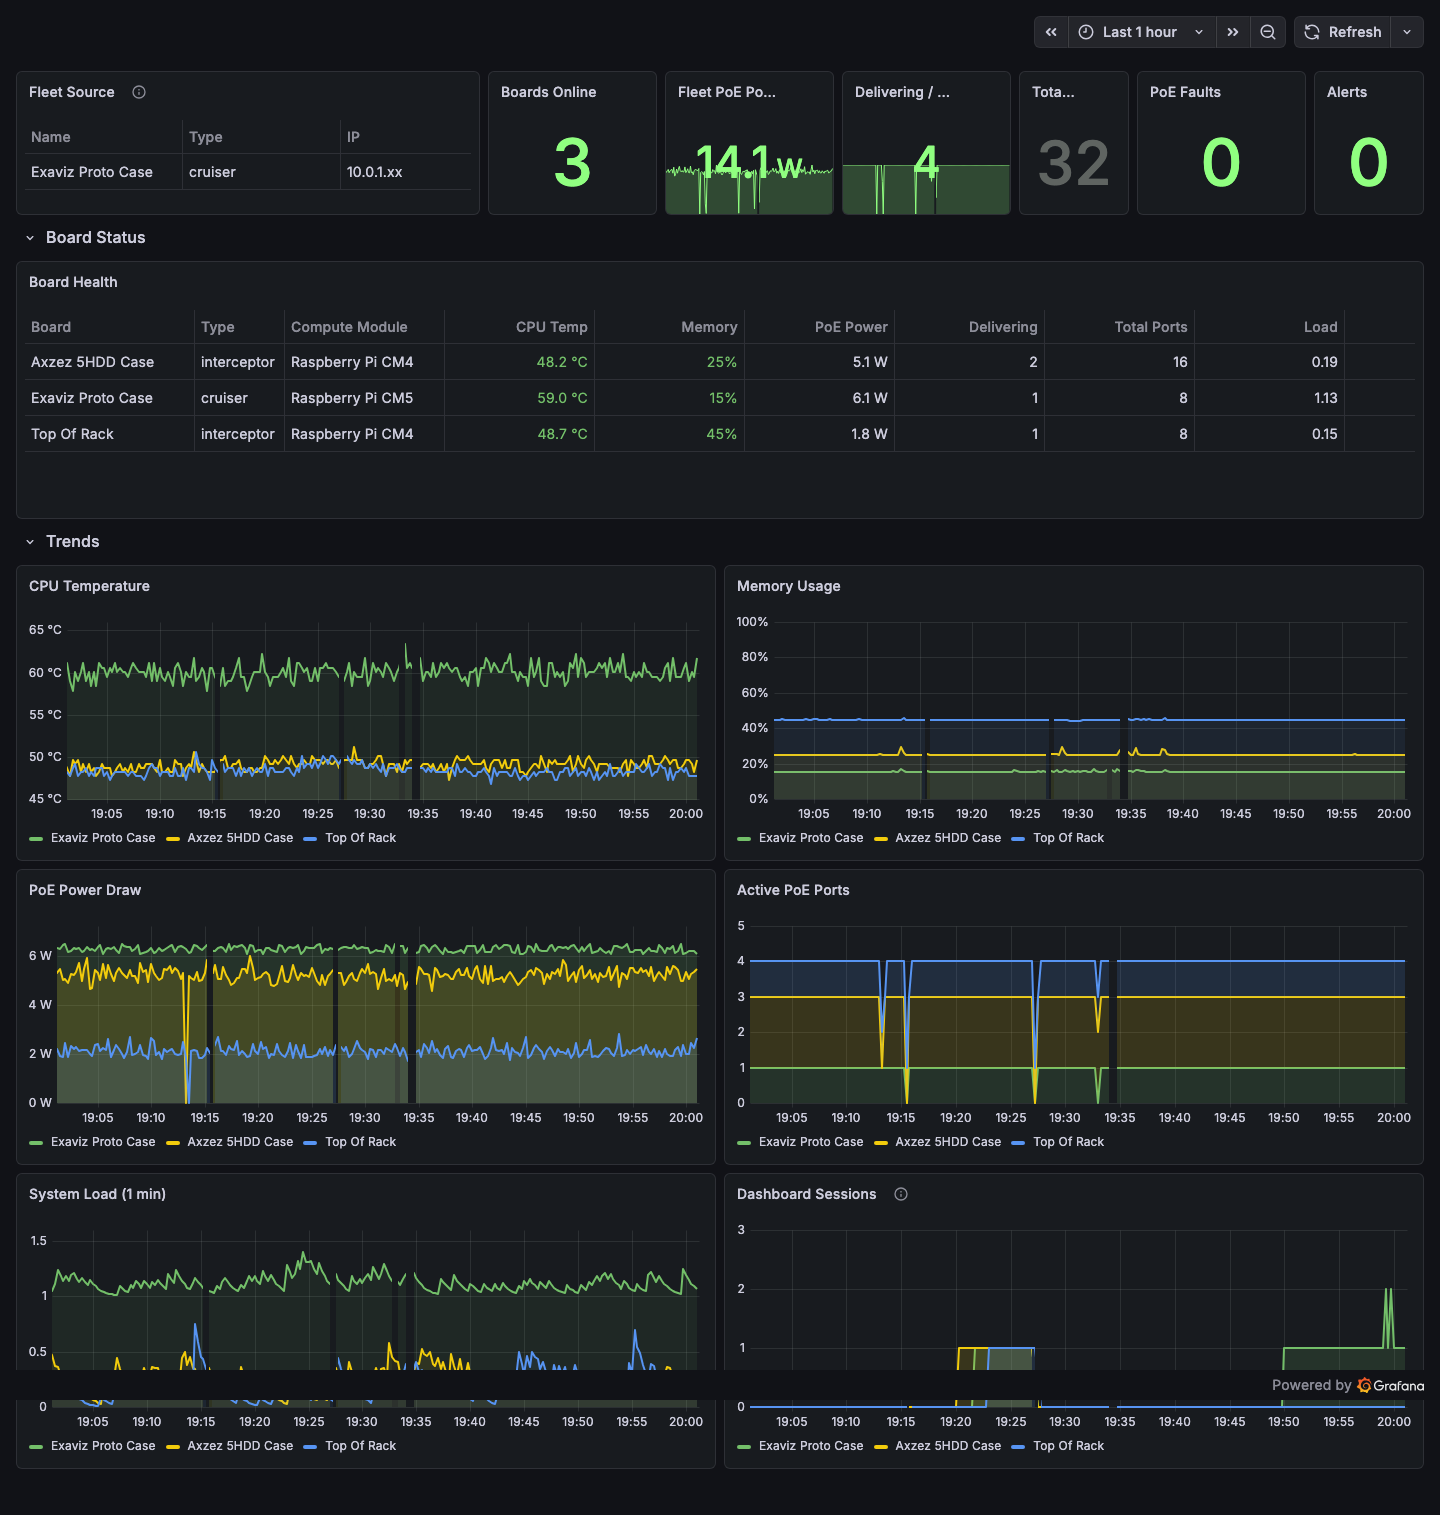
The Exaviz Fleet Overview dashboard in Grafana showing 3 boards: fleet summary stats, per-board health table with color-coded thresholds, and trend charts for CPU temperature, memory, PoE power, active ports, system load, and dashboard sessions. Auto-refreshes every 15 seconds.
Available Metrics
| Category | Metrics |
|---|---|
| Go runtime | Goroutines, memory allocation, GC stats |
| Board identity | Serial, type, firmware version, board name |
| System health | CPU temperature, memory usage, uptime, load average |
| PoE ports | Total power draw, port count by state (delivering, searching, disabled, fault) |
| SSE clients | Number of connected dashboard sessions |
| Fleet | Total boards, online count |
Integration
Point your Prometheus server at https://<board-ip>/metrics and build Grafana dashboards for fleet-wide visibility. A sample Docker Compose stack (Prometheus + Grafana + Nginx) is available for quick setup.
Why this matters for OEMs: If your customers already run Prometheus and Grafana, the Exaviz boards integrate with their existing monitoring stack on day one. No custom integration work needed.
Additional Features
Real-Time Updates (SSE)
The dashboard uses Server-Sent Events for real-time updates. The browser maintains a persistent connection and receives PoE port status, switch port status, and system health every 2 seconds. A live indicator pulses green when the connection is active.
In-App Help
A contextual help modal provides guidance for every section of the dashboard. Help content adapts to the board’s features (e.g., fleet help only appears if fleet management is enabled). Help text references the configured product name and support URLs, so OEM-branded boards show OEM help content.
File Browser Integration
An optional built-in file browser provides web-based access to the board’s filesystem. The file browser is branded to match the dashboard theme and OEM configuration.
TTY Console (HDMI Output)
For boards connected to a monitor via HDMI, the exaviz-console service displays a real-time status screen with ANSI art showing PoE port status, system health, and board identity. A kiosk mode (Wayland Cage + Chromium) can display the full web dashboard on the connected display.
Board Auto-Detection
The platform automatically detects the board variant (Cruiser, Cruiser Lite, Cruiser Keel, Interceptor) via device tree, config files, and PSE interface availability. The UI adapts to show the correct number of ports and features for each variant. No manual configuration required.
What’s Next
See the White-Label Guide for OEM branding details, or the API Reference for integration documentation.
Last modified April 9, 2026